
The 100ms Budget: How Whistlr Is Rebuilding Its Stack Around a Single Number
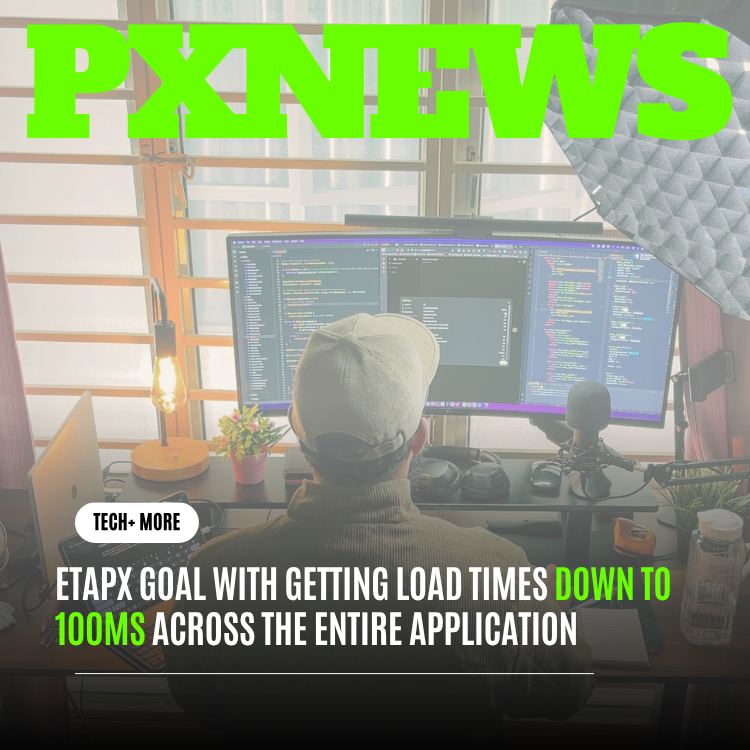
Somewhere between a tap and a feed full of content sits a number Whistlr's engineering team has decided to treat as sacred: 100 milliseconds. Not as a marketing slogan, but as a hard budget that every screen, query, and asset now has to justify itself against.
Most product teams treat speed as a bug category — something you fix when users complain, or when a dashboard turns red. Whistlr's performance group inverted that framing about a year ago. Latency stopped being a QA checkbox and became a design constraint, sitting next to accessibility and information architecture in every review. If a new feature couldn't fit inside the budget, it didn't ship as designed — it got re-architected until it did.
That shift sounds simple. Executing it across a React Native app running on thousands of device configurations, a Next.js web client, and a Postgres-backed API layer serving millions of feed requests a day is not. This is a look inside how the budget is built, where the milliseconds actually go, and what changed in the stack to bring load times down across the app.
The project started as an internal audit roughly six months ago, prompted less by a single outage than by a slow accumulation of one and two hundred millisecond regressions spread across a couple dozen high-traffic endpoints — the kind of drift that never trips an alert but that, added up, changes how an app feels to hold. Fixing it meant touching nearly every layer of the stack at once: the database schema, the API contracts sitting on top of it, the caching rules in front of both, and the client code rendering the result.
Why 100ms, Specifically
The number isn't arbitrary. Human perception research has long put roughly 100 milliseconds as the threshold below which an interface feels instantaneous — not merely fast, but immediate, like flipping a physical switch. Above that line, even by a little, the brain starts registering a gap between cause and effect. Whistlr's team picked 100ms as the ceiling for the interactions that matter most to how the app feels moment to moment: opening a thread, liking a post, switching tabs, sending a message. Full page loads and cold starts get a more generous budget, but the interactions a user repeats hundreds of times a session had to hit the perceptual floor.
Getting a single target to mean the same thing across that range meant testing against a deliberately unglamorous device lab: mid-range Android hardware three or four years old, throttled to a simulated 3G-equivalent connection, sitting alongside the latest flagship phones on fast Wi-Fi. A feature that only hit 100ms on the flagship end of that spectrum didn't count as done.
Once latency became a per-feature budget line instead of a post-launch cleanup task, the roadmap changed shape. Caching moved earlier in the design process. Payload size became a review gate, not a retrofit. Navigation, which used to be an afterthought once a screen was built, became its own engineering discipline.
Mapping the Stack: Where the Milliseconds Actually Go
Before any of that could happen, the team needed a real accounting of where time was being spent. The instrumentation work alone took several weeks: distributed tracing across the API gateway, the Postgres query layer, the CDN edge, and the client render path, stitched into a single waterfall per request. What came back was humbling. On a typical cold feed load, the breakdown looked roughly like this before the rework began:
- DNS and TLS handshake: 40-90ms, highly variable by network and region
- API gateway routing and auth check: 30-60ms
- Primary database query for feed assembly: 120-280ms, worst on a cold cache
- Serialization and payload transfer: 60-150ms, scaling with response size
- Client parse, hydrate, and first paint: 90-200ms depending on device class
Added together, a cold feed load could run north of 600ms before a single pixel of real content appeared — and that's before accounting for older or budget Android devices, which the team tracks as a separate cohort but which pushed client-side numbers even higher. The 100ms target doesn't apply evenly across that whole waterfall; it applies to the parts of the experience a user actually feels as "did this respond to me." That reframing is what let the team attack the problem layer by layer instead of chasing one global number that meant different things in different places.
Caching as a First-Class Architecture Decision
The single biggest lever turned out to be caching — not as a bolt-on optimization, but as something decided at the same time as the data model. Whistlr's API layer now runs a three-tier cache in front of Postgres: an in-memory hot cache for the highest-frequency reads like profile cards, follow states, and active session data; a regional edge cache for feed pages and public content; and materialized views inside Postgres itself for the expensive aggregate queries — comment counts, engagement rollups, trending signals — that used to be computed live on every request.
Killing the N+1 Feed Query
The feed endpoint was the worst offender. Assembling a single page used to mean one query for the post list, then a fan-out of secondary queries for author data, media metadata, and engagement counts per post — a textbook N+1 pattern that scaled badly the moment a feed page grew past 20 items. The fix was a scheduled materialization job that pre-joins posts with their author and engagement data on a short cycle, so the read path became a single indexed lookup instead of a query storm. Feed assembly time on the database side dropped from a p95 of roughly 260ms to under 35ms.
Edge Caching Public Reads
For content that doesn't depend on a specific viewer — public profiles, trending pages, post detail views before personalization kicks in — the team pushed caching out to the edge, close to where requests actually originate instead of a single origin region. That cache now runs across more than 20 global edge locations, positioned so the large majority of requests resolve within the same metro region as the user making them. Cache hit rates on those routes now sit above 91%, and a cache hit resolves in single-digit milliseconds instead of making a round trip to the origin at all.
None of this works without aggressive invalidation, which is usually where naive caching strategies fall apart. Whistlr's cache layer is tag-based rather than time-based wherever possible. Every cacheable object in the system carries a small set of invalidation tags — post ID, author ID, thread ID — so a single write only busts the handful of keys actually affected by it, not the surrounding neighborhood of unrelated cached content. That precision is what let the team push cache lifetimes up without introducing the stale-content bugs that usually come bundled with them.
Client-Side Memory and Disk Cache
The last hop in the caching chain lives on the device itself. Both the React Native app and the Next.js web client now keep a short-lived in-memory cache of recently viewed feed pages, profile data, and thread state, backed by a disk-persisted layer for data that should survive an app restart. Returning to a tab you left thirty seconds ago no longer triggers a full refetch — the client renders straight from memory while a background revalidation quietly checks whether anything actually changed. On the app side, this sits on top of React Native's newer rendering architecture, which removed a chunk of the bridge serialization overhead that used to sit between a cache hit and a pixel landing on screen.
Shrinking the Payload
Caching solves how fast data can be produced. It doesn't solve how much of it has to travel over a network that, for a meaningful share of Whistlr's user base, is a mid-tier mobile connection with real latency and packet loss. So the second front of the 100ms push was payload size.
The feed API response was carrying a lot of dead weight: full user objects nested inside every post, verbose field names, and metadata the client wasn't even rendering on first paint. Trimming that down — thinner response shapes, shortened field keys on hot endpoints, deferring non-critical metadata to a secondary request — cut the average feed page payload by roughly 47%, from around 38KB to just over 20KB gzipped for a standard page of content.
Images and video thumbnails got the same treatment. The media pipeline now serves AVIF where the client supports it, falling back to WebP and then JPEG, with responsive sizing so a feed thumbnail never ships a full-resolution asset it's only going to downscale anyway. Combined, media-related bytes on a cold feed load dropped by close to a third.
Trimming the Feed Endpoint, Concretely
The feed endpoint is a useful example of how granular this work got. A single post object used to carry the full author record — bio, follower count, verification metadata, avatar variants at five different sizes — even though the feed card only renders a name, a handle, and one avatar size. The endpoint now returns a minimal author summary by default and defers the rest to the profile route, which loads it lazily only if someone actually taps through. Applied across an average feed page of 20 posts, that single change accounted for close to a third of the total payload reduction on its own.
Navigation as Its Own Discipline
The last major piece was navigation — the feeling of moving between screens inside the app. Even with a fast API and a light payload, a screen transition that blocks on a network request before rendering anything will always feel slow. Whistlr's client teams adopted a prefetch-on-intent model: when a user's thumb is on a post that's about to be tapped, or a profile card scrolls into a likely-tap zone, the client speculatively starts fetching the detail view before the tap actually lands. By the time the navigation animation finishes, the data is frequently already sitting in memory.
Skeleton states were rebuilt to match final layout dimensions exactly, eliminating the layout shift that used to happen when real content popped in and pushed things around — a change that didn't move the raw latency number but measurably improved how fast the transition felt in internal user testing. On the Next.js side, the web client leans on route-level code splitting and aggressive prefetching of adjacent routes, so a click never has to wait on a fresh JavaScript chunk before it can render.
Interactions that write data got the same treatment from the other direction. Liking a post, following an account, or sending a quick reaction now updates the interface immediately and reconciles with the server in the background, rather than waiting on a round trip before showing any change at all. The write itself still has to succeed or roll back cleanly if it doesn't, but the perceived latency — the number that actually shapes how an app feels to use — drops to whatever it takes the device to repaint, which is comfortably inside the 100ms window on its own.
"A number on a dashboard doesn't convince anyone. What convinced the team was sitting in a room, tapping between screens on the old build and the new one back to back, and watching people's shoulders actually relax. That's the tell that you've crossed the perceptual line, not the p95 chart."
Marcus Chen, Head of Performance Engineering
Where the Budget Stands Today
The 100ms target isn't fully hit everywhere yet, and the team is explicit about that internally — it's a ceiling to keep pushing toward, not a box that gets checked once. But the interactions that get the most repetition inside a session — opening a post, liking, switching tabs, sending a reply — now land inside or very close to that window for the majority of sessions on modern devices under typical network conditions. Cold app starts and first feed loads, which carry a heavier budget by design, have still dropped by more than half from where they stood before this work began.
The instrumentation built for this project didn't go away once the initial push was done, either. Every new feature now ships with a latency budget attached before a line of code is written, and the same tracing pipeline that found the original bottlenecks now runs continuously, flagging regressions before they reach a meaningful share of users.
Getting there also meant changing how design reviews work, not just how code ships. Every new feature proposal now includes an explicit latency estimate before engineering scoping even starts, reviewed by the same performance group that built the original instrumentation. A feature that can't credibly hit its budget on paper gets redesigned at the concept stage, which is a far cheaper place to fix a latency problem than after it has already shipped to production.
The next phase of the budget pushes further down the stack: a broader rollout of newer transport protocols to cut handshake overhead on flaky mobile networks, and a second pass at the materialized view layer to bring personalized feed assembly closer to the sub-40ms mark public content already hits. None of that changes the underlying philosophy. Latency isn't a metric Whistlr's engineering team checks after shipping — it's a constraint every feature has to design around before a line of code exists, the same way accessibility or data privacy already are. The 100ms line is less a finish line than a permanent fixture of how the app gets built from here, and how its load times keep getting measured against it.